Become A Cori Elite Athlete -

TrackLactate,WithoutNeedles

Understand The Science Behind Cori

Innovative | Comprehensive | Always On

Unlock Early Access

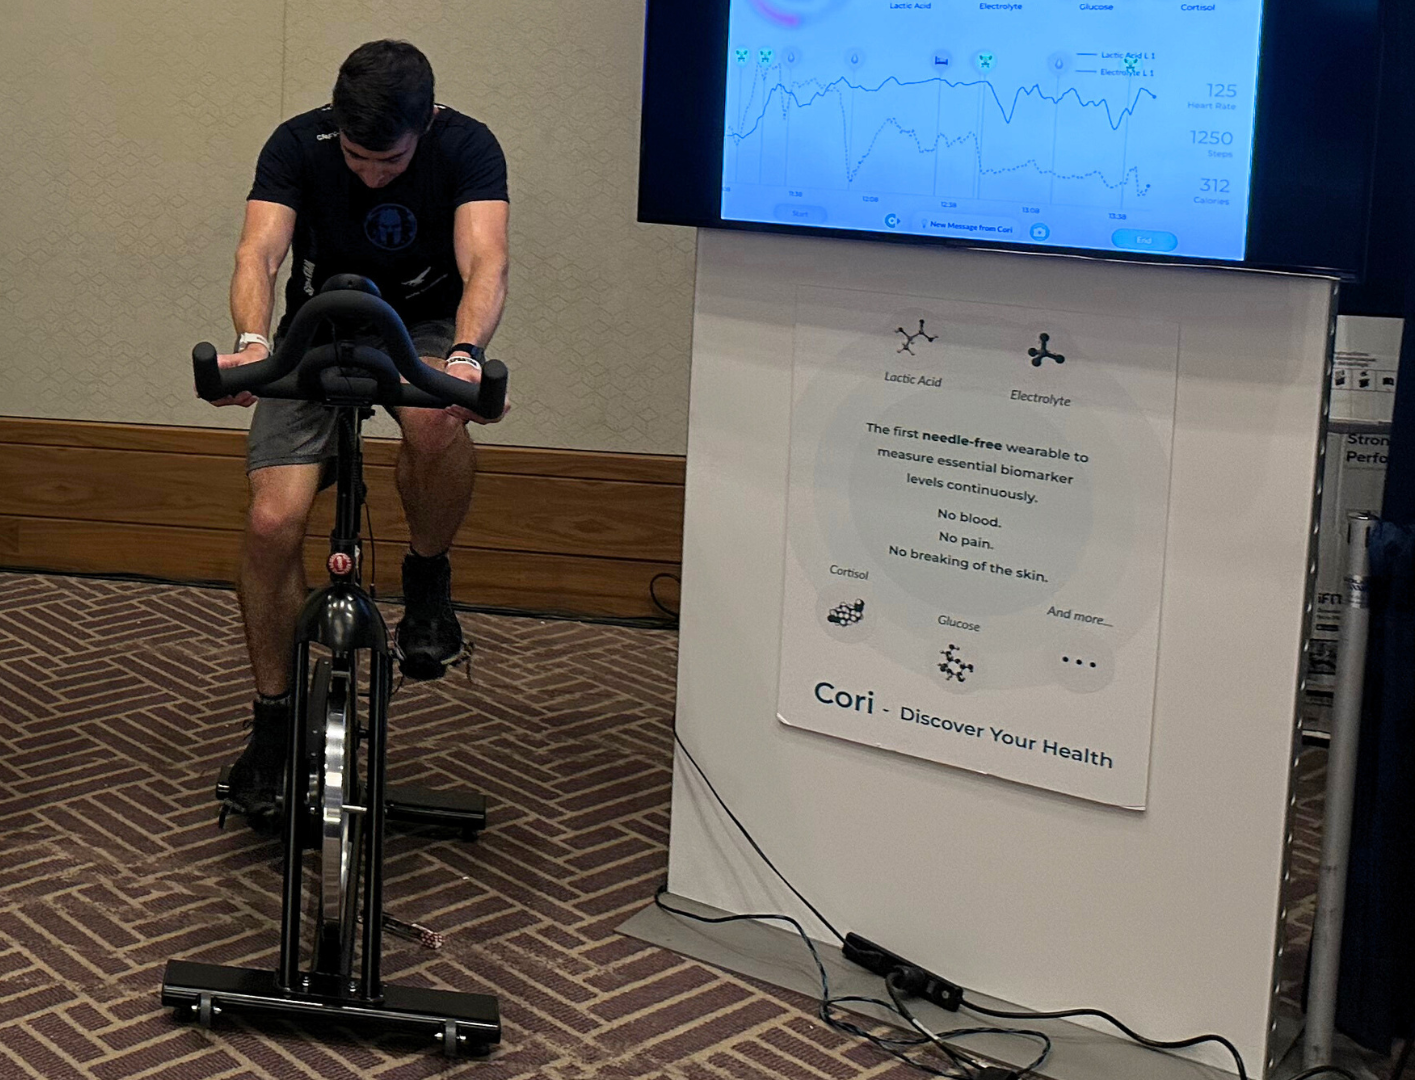
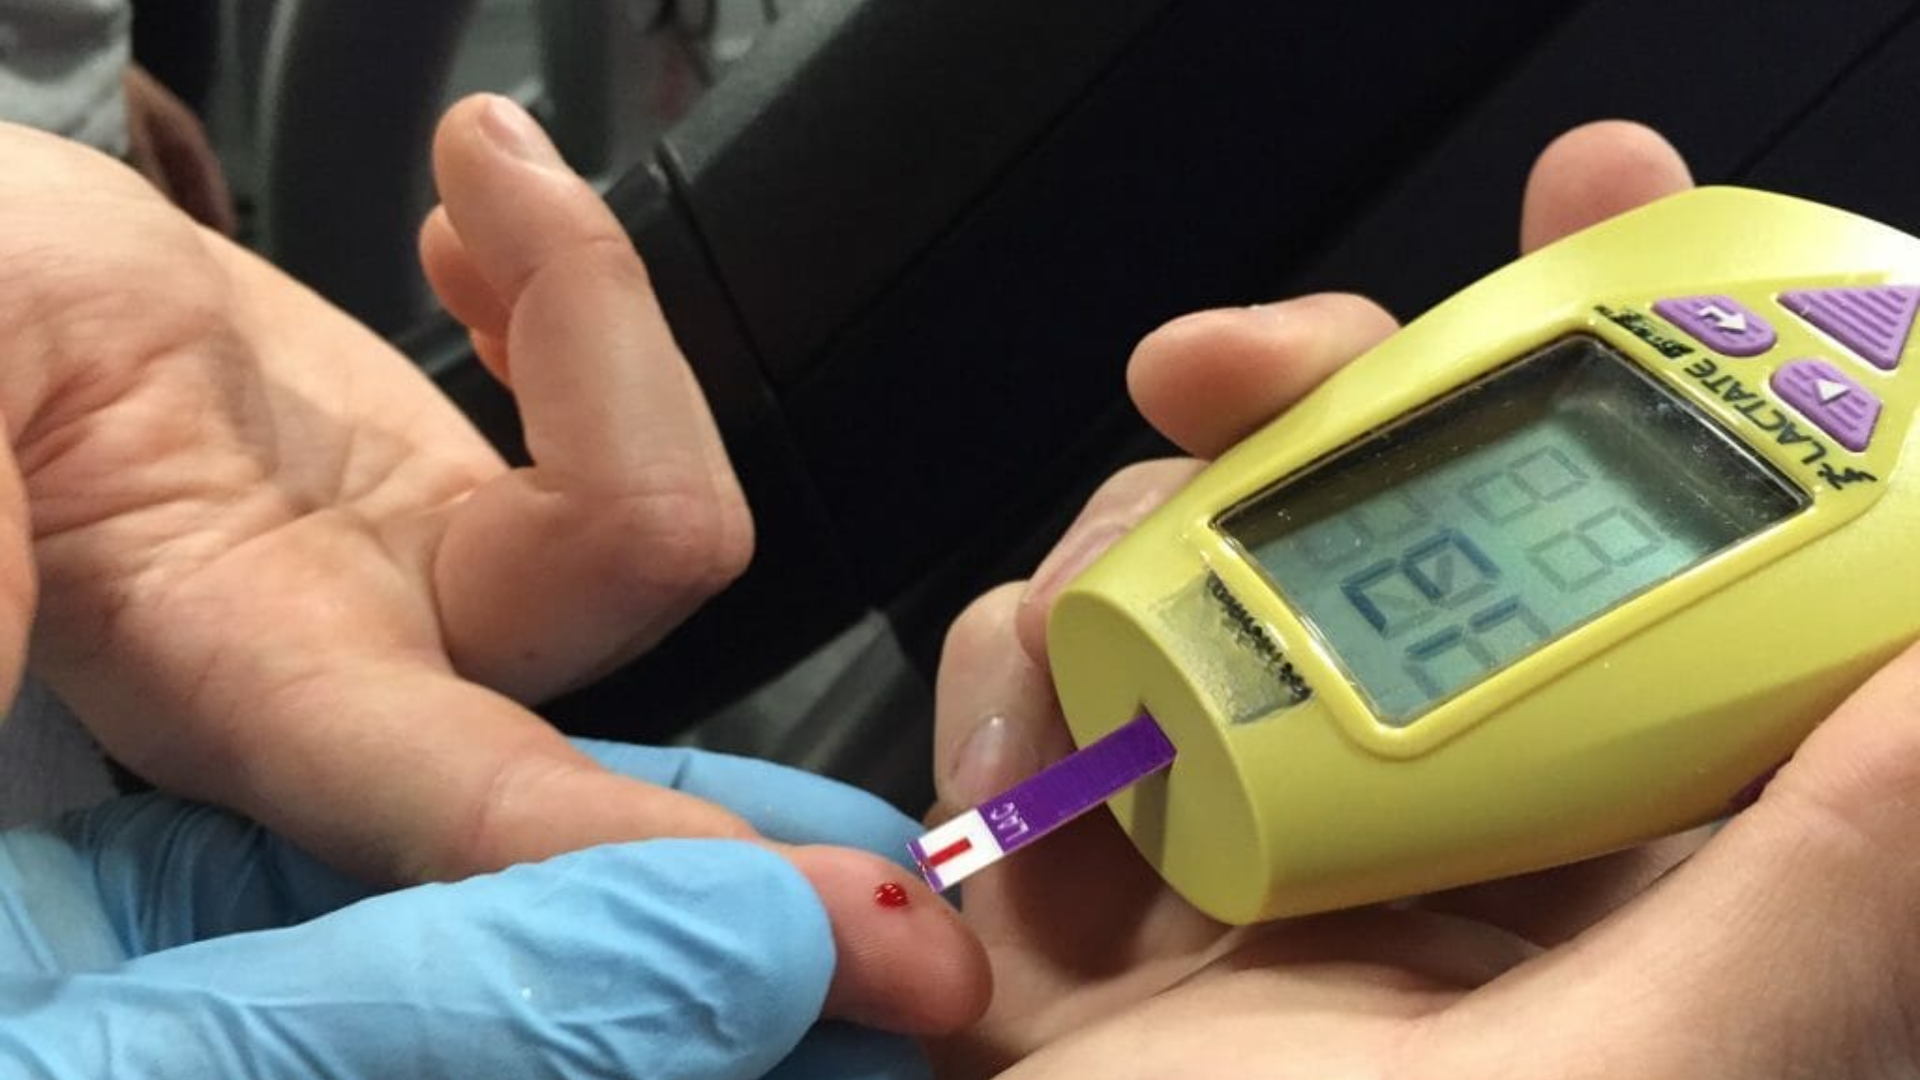
How we measure lactate without needles

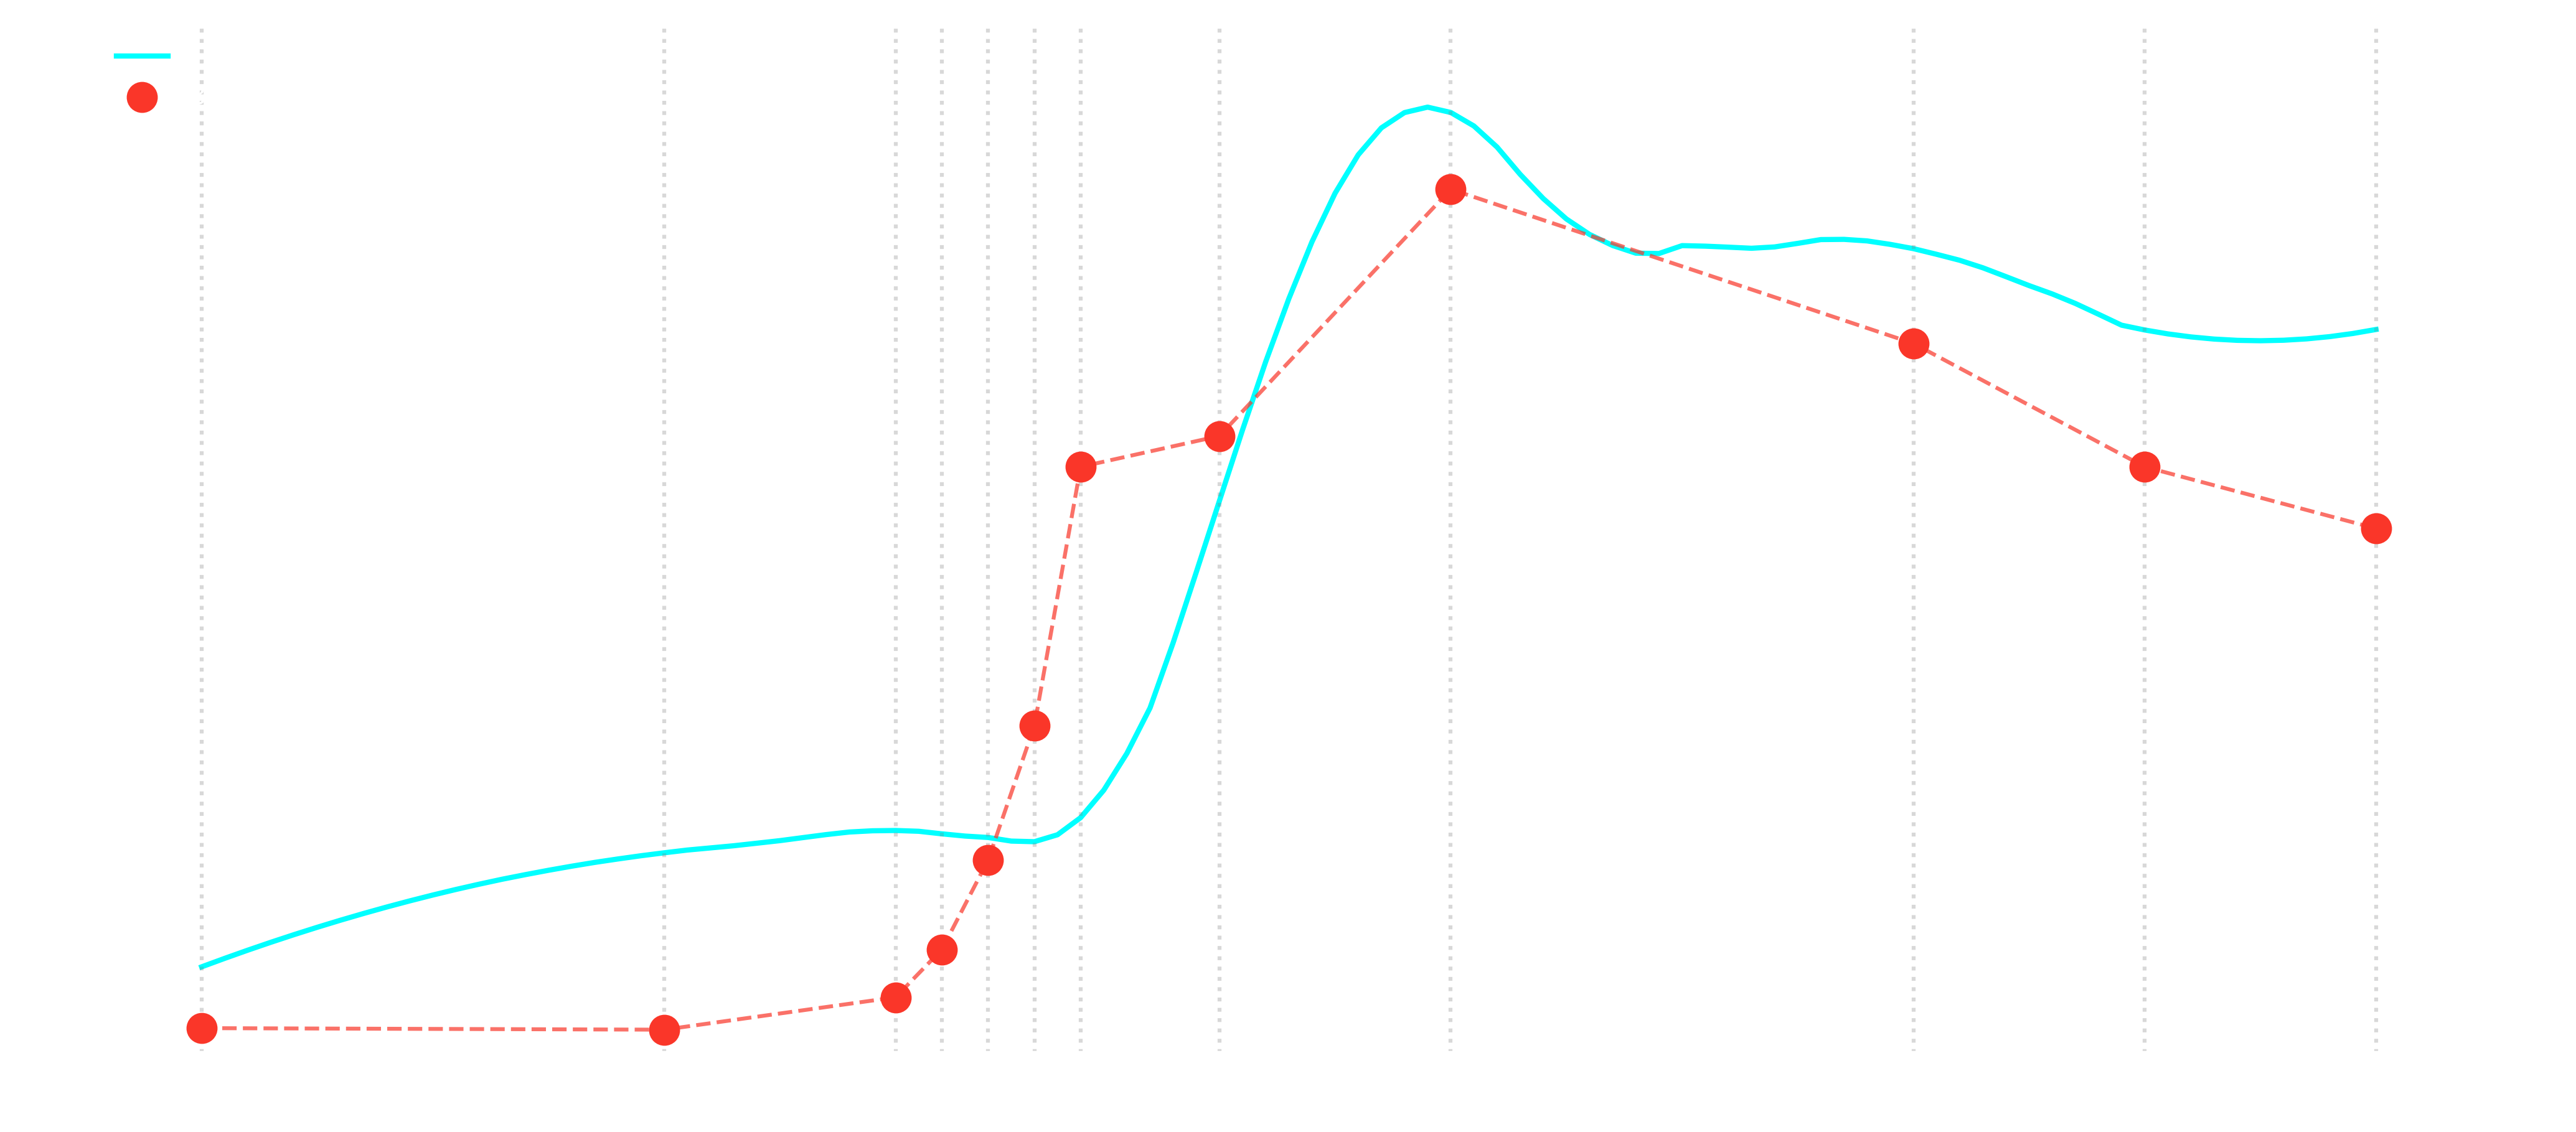
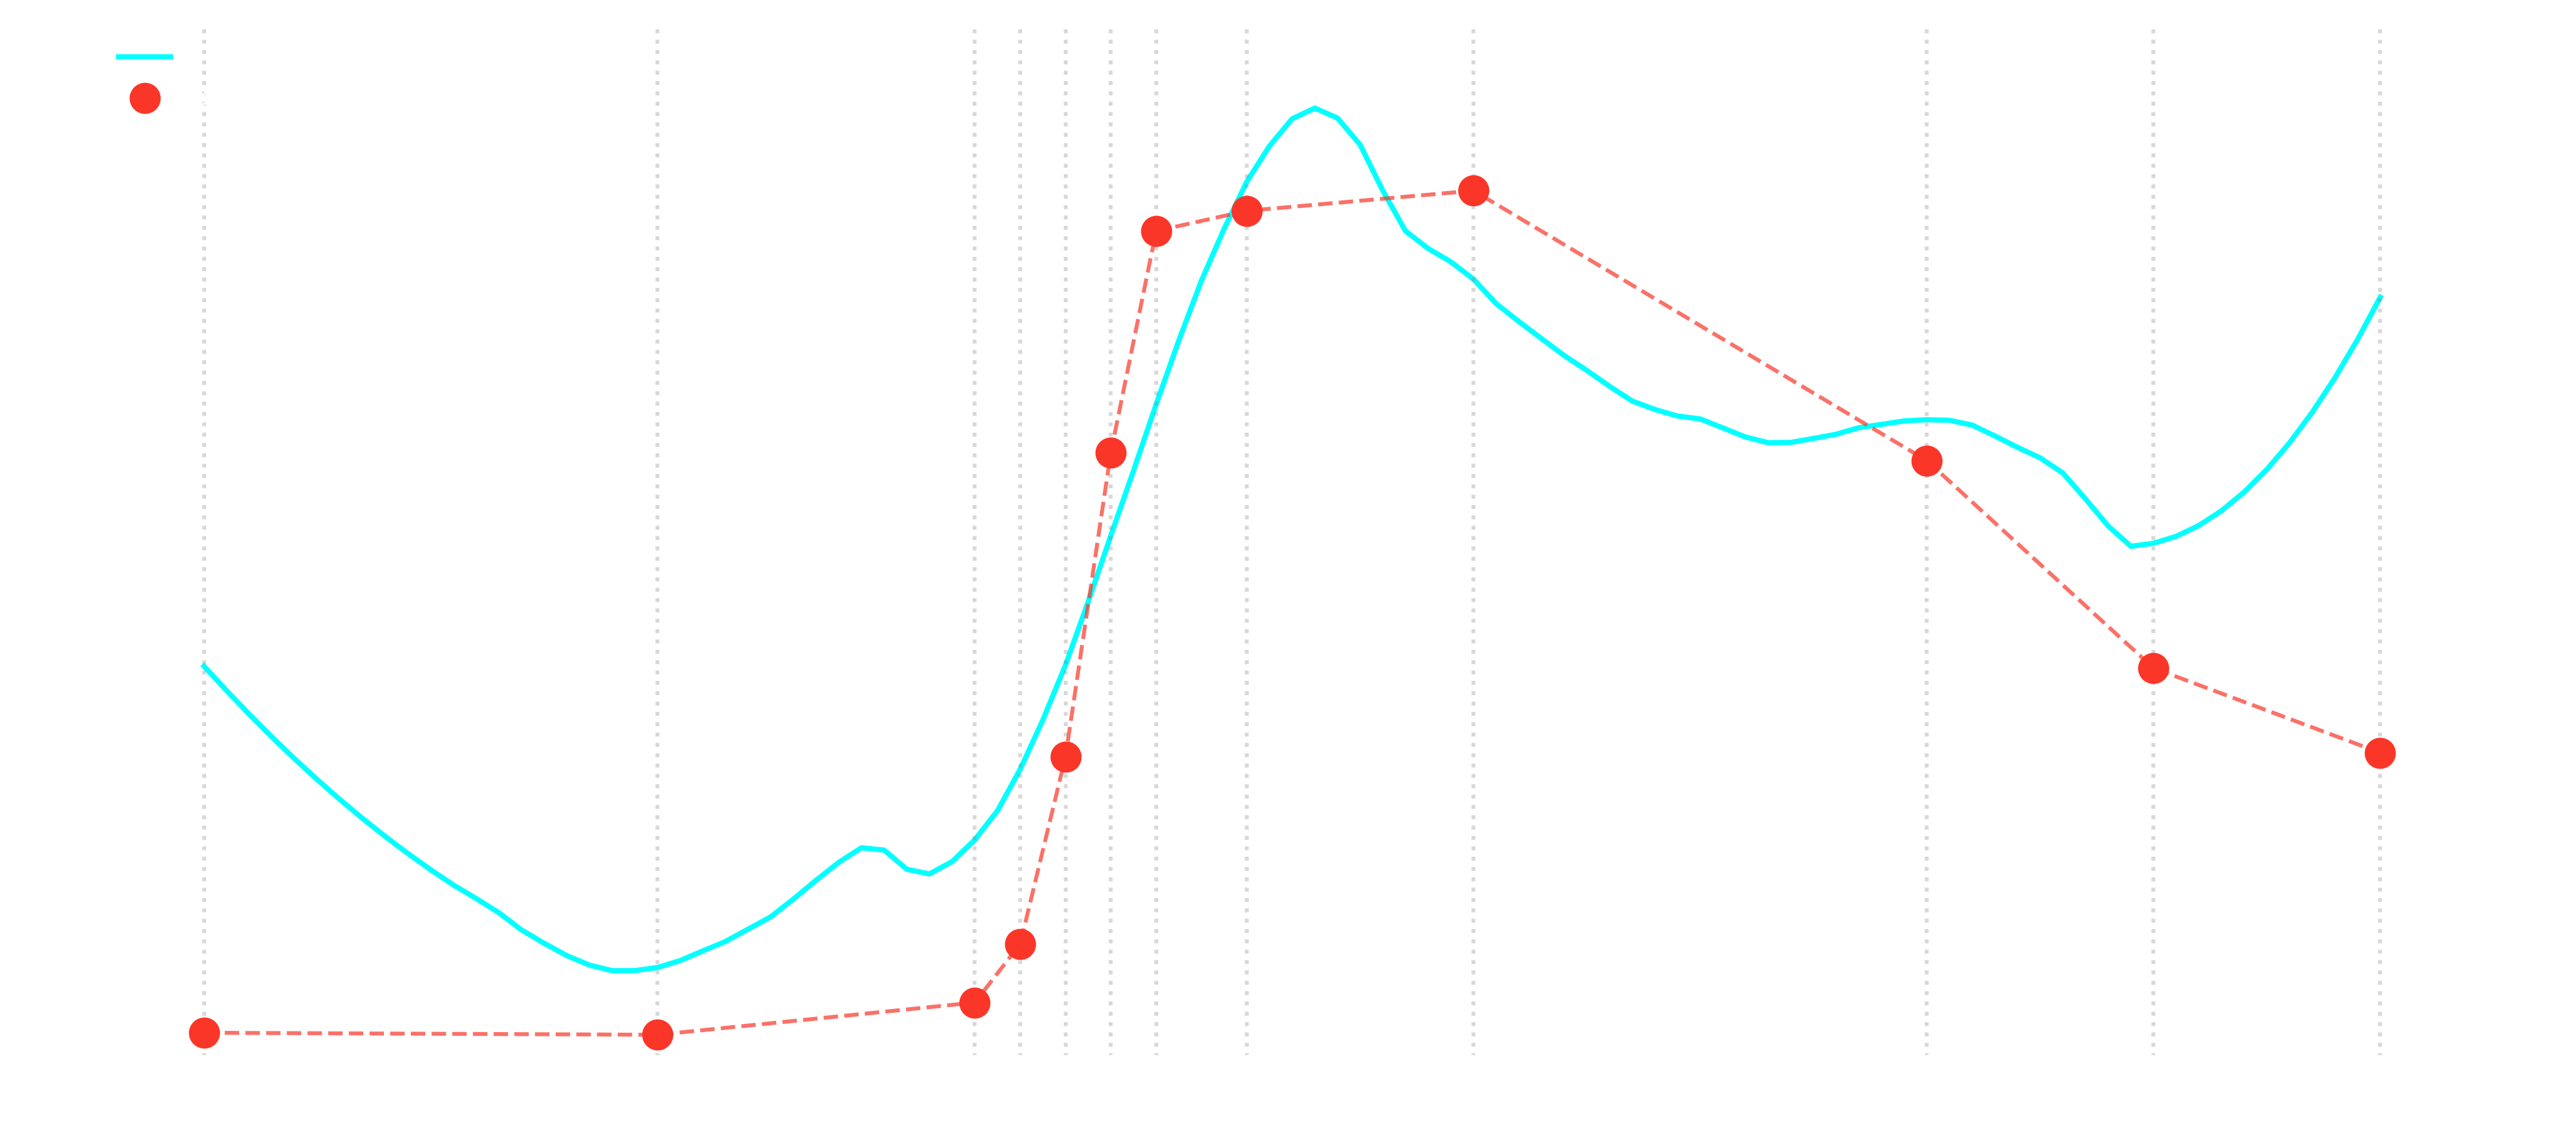
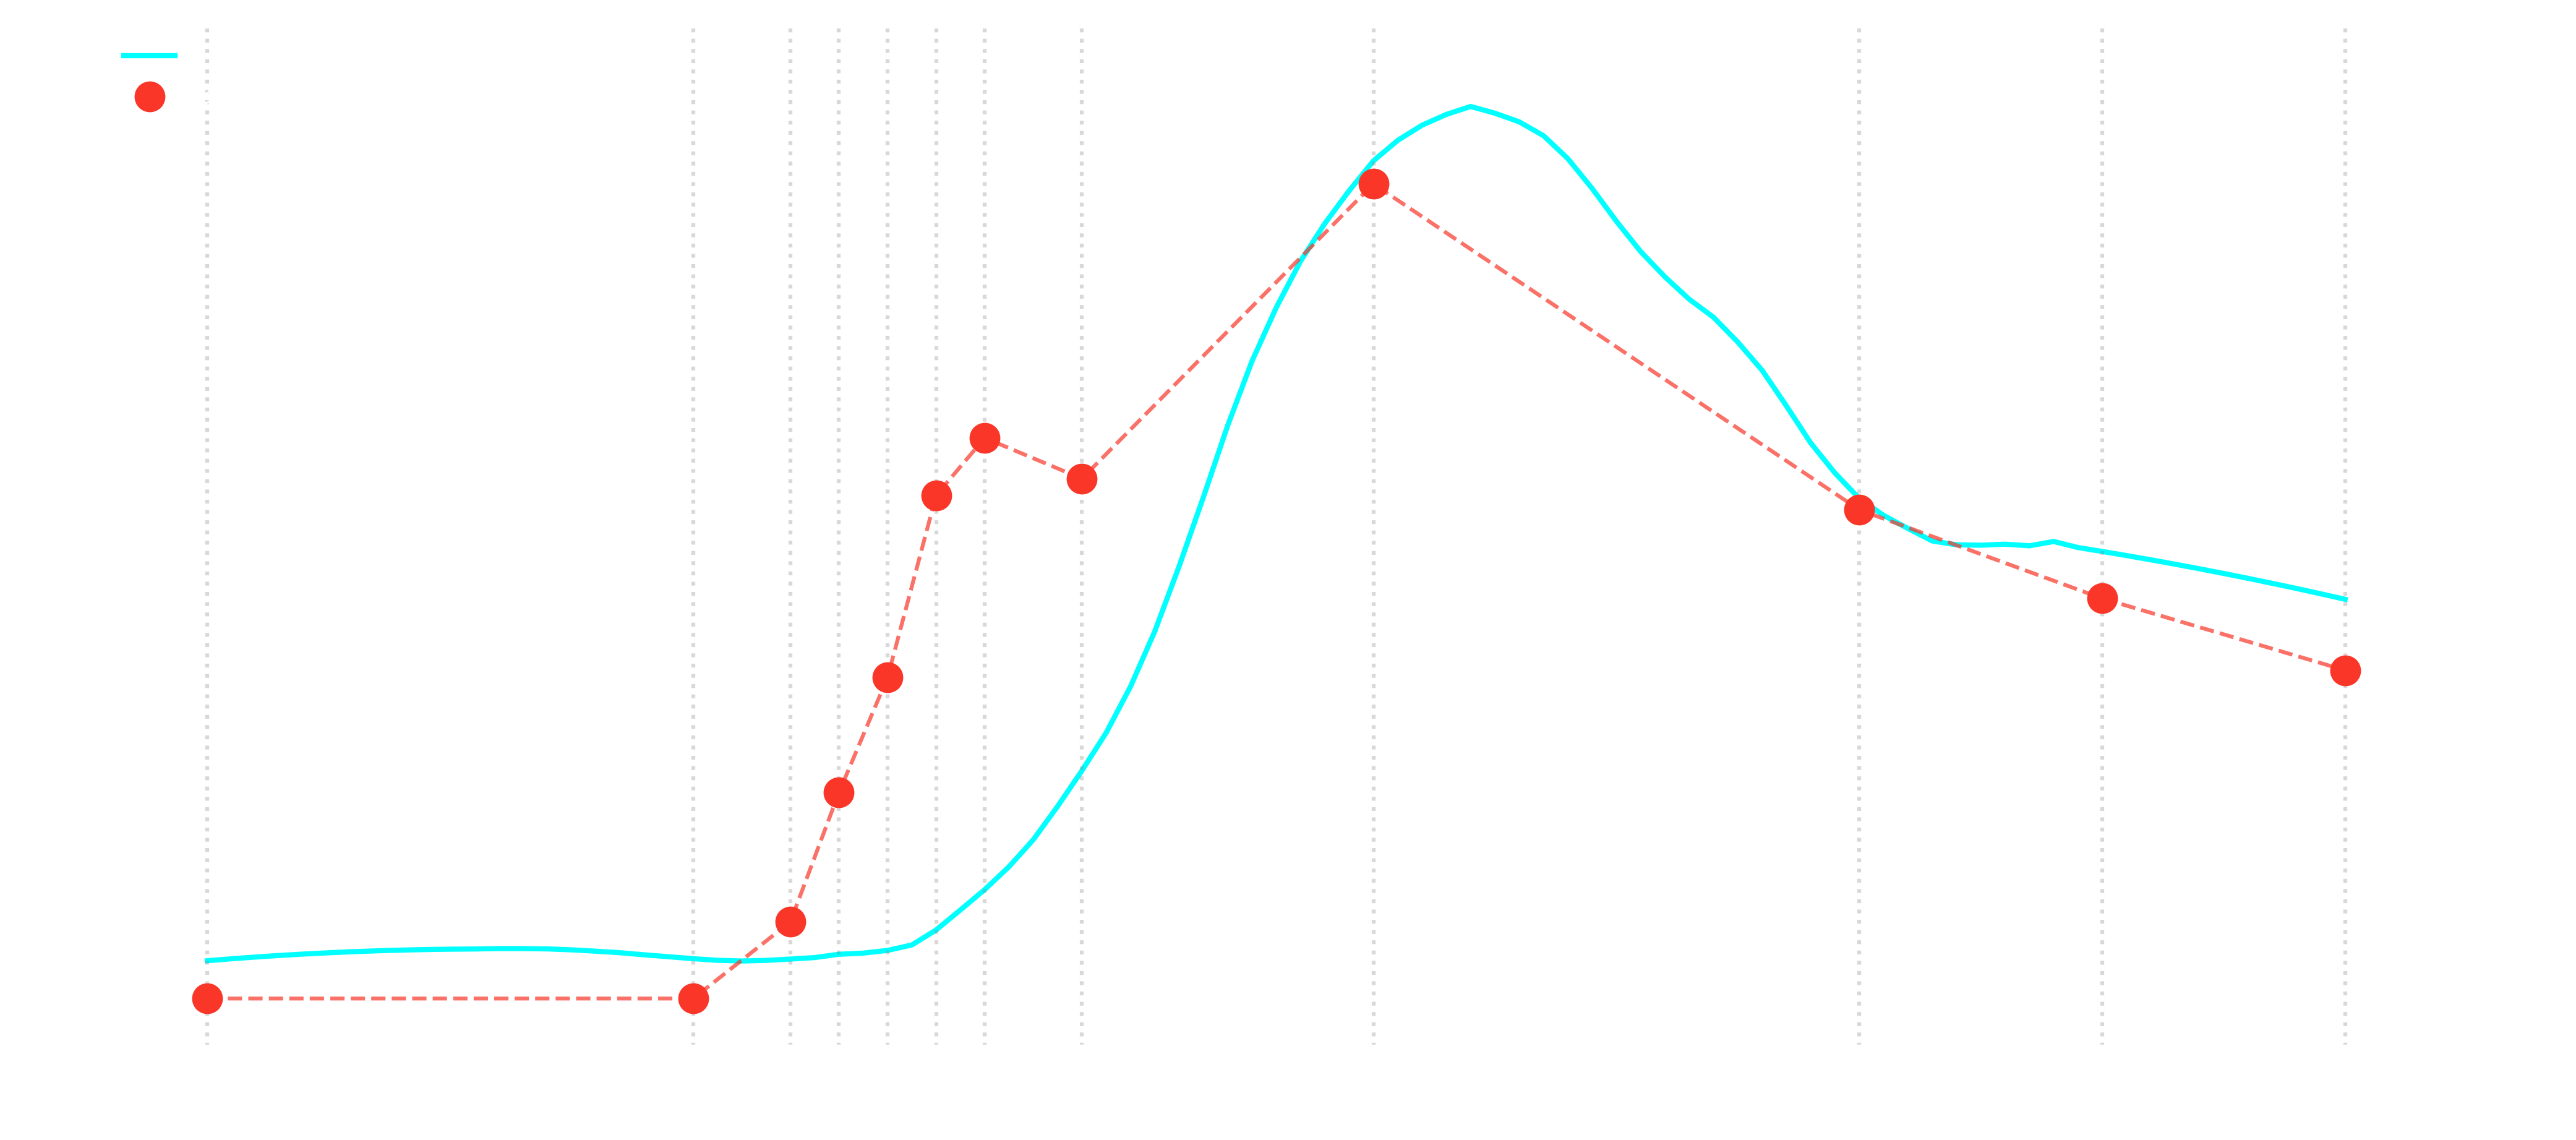
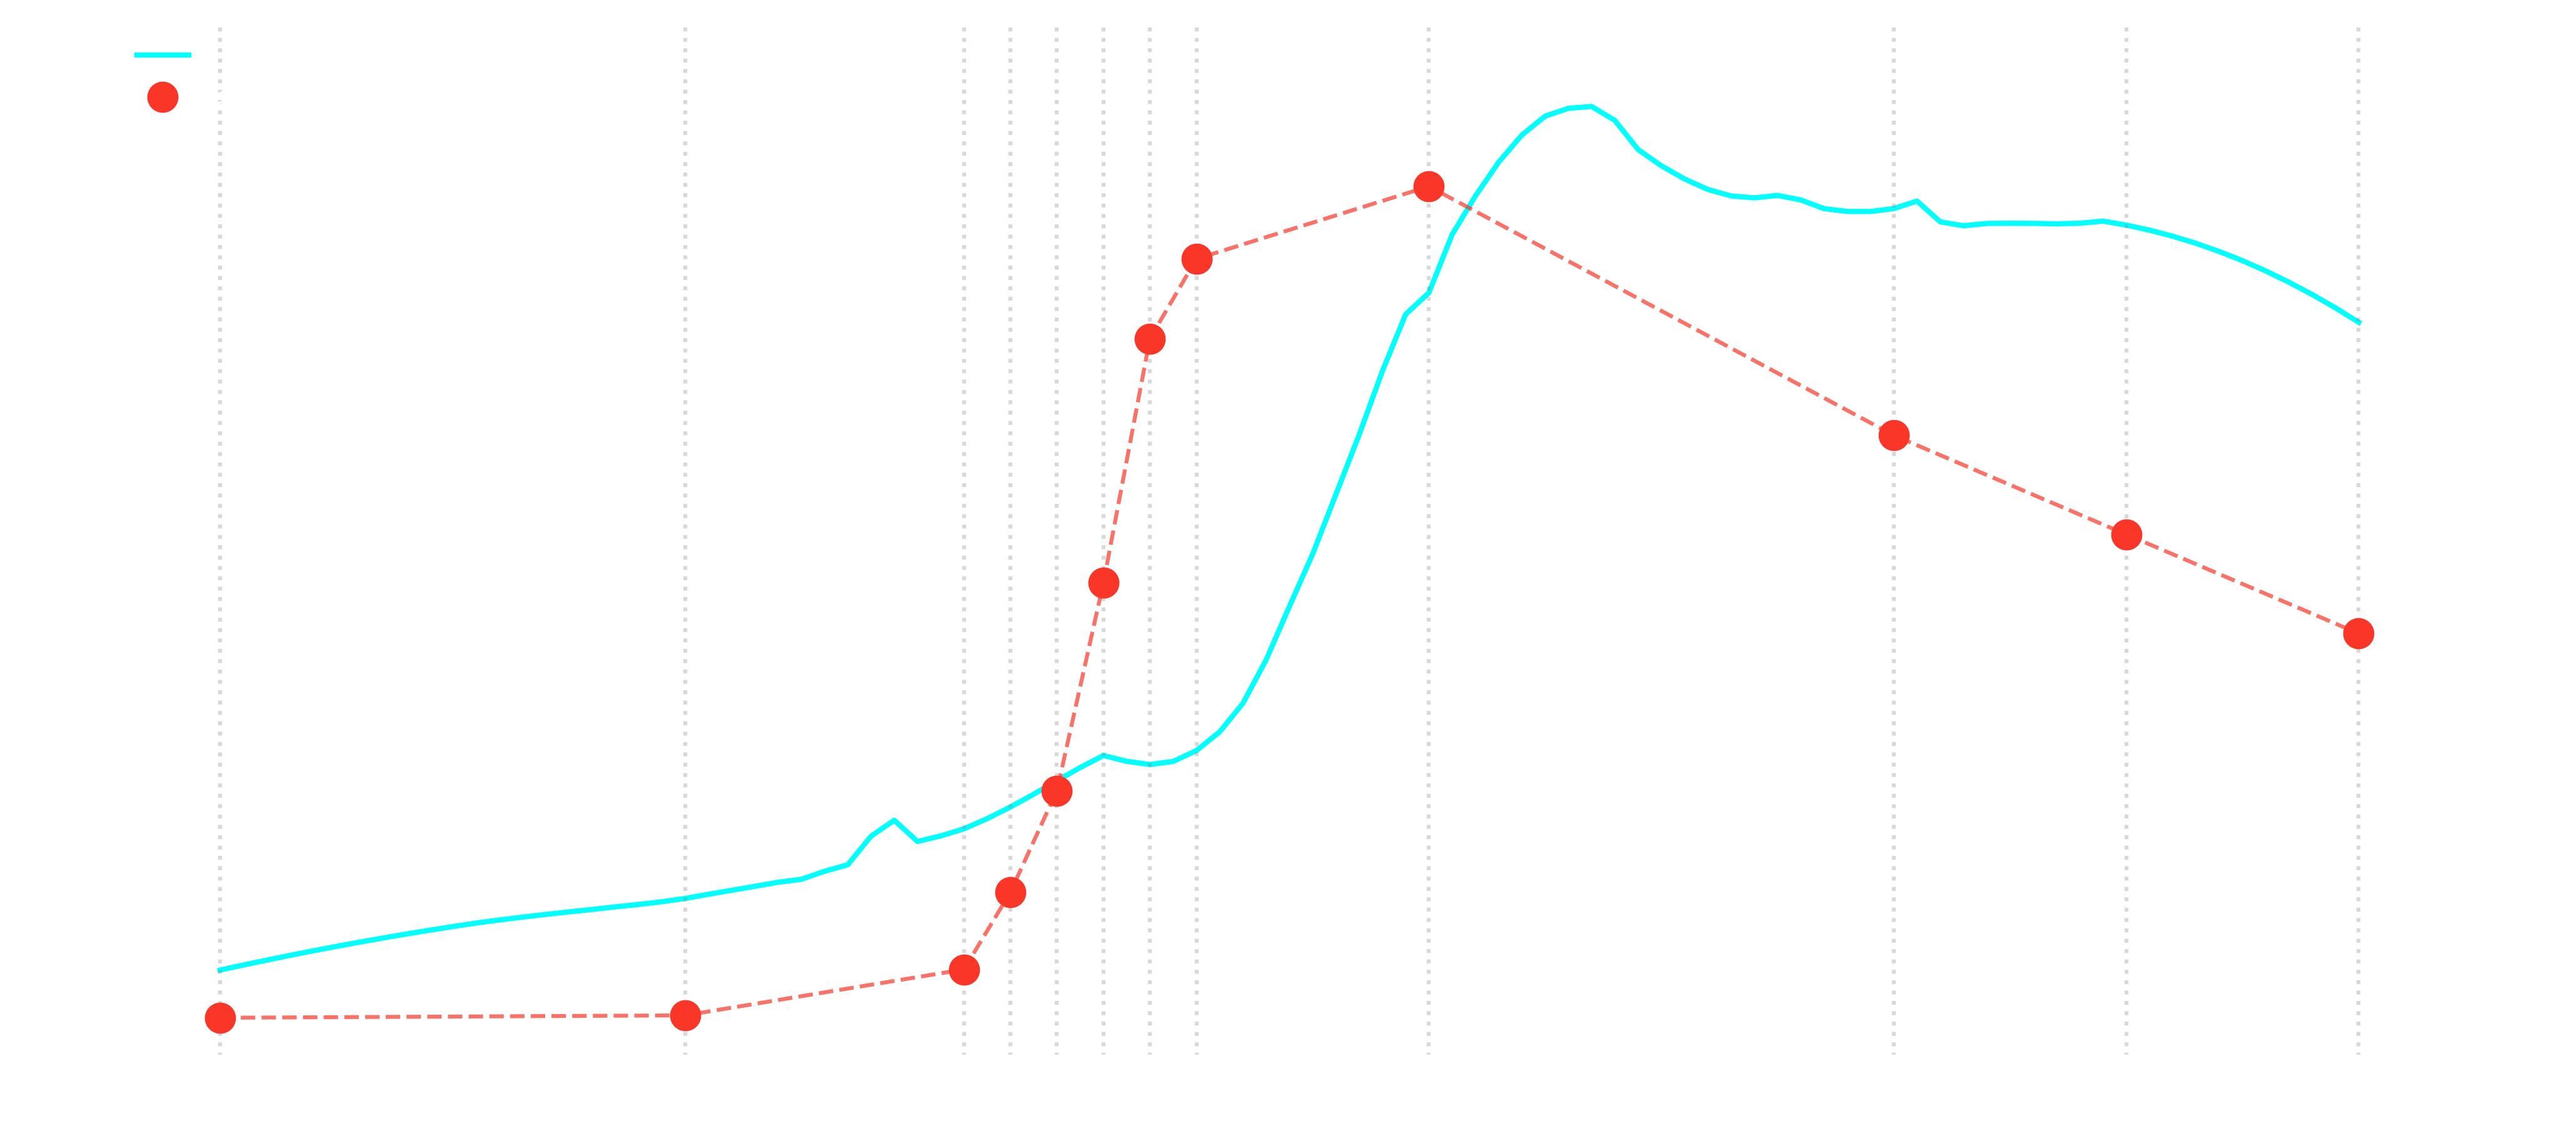
Cori measures lactate at the skin surface using electrochemical nanotechnology. We do not pass current through your skin. Instead, we rely on passive diffusion of analytes from sweat/interstitial fluid to a selective sensing layer, then convert molecular binding into an electrical signal the device can read.

01

Accessing the sample matrix Interstitial fluid + Sweat → Skin surface

Our body exudes a mixture of sweat and interstitial fluid (ISF), the sample matrix, which contains ions and molecules in very small quantities. Cori accesses analytes from this matrix by diffusion, where lactate and ions migrate toward the sensor interface without any skin puncture. The sensor also creates a very small electromagnetic field that polarizes ions within the sample matrix beneath the skin, drawing those ions - along with the target molecule, lactate - toward the sensor surface. No electrical current is passed through the skin.

02

Capturing lactate molecules Nanoscale electrochemistry → Electrical signal

When lactate molecules reach the sensor surface, they bind to a layer coated with lactate-specific protein molecules. This lock and key interaction initiates an electrochemical reaction that releases electrons only when lactate is present, giving the signal molecular specificity. Because the interstitial fluid is extremely dilute, the resulting electron signals are small. These raw signals then enter the field-effect layer, where they are amplified and stored for the wearable device to process in the next step.

03

Lactate molecules into actionable insights Molecules → Actionable insight

The small electron signals from the electrochemical layer of the sensor are routed into a field-effect transduction stage, where changes in surface charge modulate a semiconductor channel and amplify the signal. The device continuously reads these processed signals, stores them locally, and displays the current lactate value on the screen. It also prepares the data for wireless transfer, sending the processed signal to the Cori mobile app, where it is organized into real-time values, trends, and session metrics in the next step.

Validation Across All Kind Of Athletes

We evaluated Cori against reference blood lactate in lab protocols and field sessions with human and equine athletes. Below are representative results:

Equine study setup
Equine sensor placement

Study Design

  • Subjects: Eight Standardbred horses completed a treadmill protocol
  • Sensor Placement: Worn on shaved upper back
  • Blood Sampling: Venous blood drawn via jugular catheter at rest, during incremental speed increases (4-9 mph), and post-recovery
  • Analysis: Plasma lactate analyzed and compared with continuous sensor data

Cori vs Blood Plasma Lactate:
Real-Time Validation

Real-Time validation data of six representative equine athletes

Equine blood vs Cori lactate study 1
Equine blood vs Cori lactate study 2
Equine blood vs Cori lactate study 7
Equine blood vs Cori lactate study 4
Equine blood vs Cori lactate study 9
Equine blood vs Cori lactate study 6

Cori vs Blood Lactate Correlation

Equine athletes scatter plot correlation

Validation Statistics

R² = 0.84 Correlation Coefficient
94% Spearman Tracking
95.2% Threshold Sensitivity
0.8 - 37.5 Dynamic Range (mmol/L)
Human study setup
Human sensor placement

Study Design

  • Subjects: Eighteen participants wore the sensor on wrist during real-world activity
  • Sensor Placement: Worn on the wrist
  • Reference: Capillary blood lactate using Lactate Plus blood lactate meter
  • Setting: Real-world activity conditions like running, cycling, HIIT, etc.

Cori vs Capillary Blood Lactate:
Real-Time Validation

Real-Time validation data of six representative human athletes

Human blood vs Cori lactate study 1
Human blood vs Cori lactate study 2
Human blood vs Cori lactate study 3
Human blood vs Cori lactate study 4
Human blood vs Cori lactate study 5
Human blood vs Cori lactate study 6

Cori vs Blood Lactate Correlation

Human athletes scatter plot correlation

Validation Statistics

R² = 0.82 Correlation Coefficient
91% Spearman Tracking
96.9% Threshold Sensitivity
0.9 - 19.4 Dynamic Range (mmol/L)

Measure What Matters.

Train By Physiology.

Real-time lactate, not guesswork.

From Molecules To Metrics On Your Phone

Real-time values → Trends → Training intelligence

Cori device turns raw lactate signals into clear, intuitive training feedback you can use immediately and sends the data to the Cori mobile app over Bluetooth. The app displays real-time lactate values, live trend arrows, personalized zones, and automatic markers for splits and intervals. During your session, Cori flags threshold crossings, rising fatigue, and recovery transitions, letting you see exactly how your body is responding in the moment. Afterward, your workout is distilled into actionable insights that help you fine-tune pacing, intensity, and training load with confidence.

Live Lactate Zones App Screen
Athlete training

Live Lactate Zones

Real-time zones with automatic thresholds. Hold pace when it matters.

Adaptive Intervals App Screen
Athlete training

Adaptive Intervals

If lactate spikes early, Cori adjusts on the fly to protect quality.

Post-Session Insights App Screen
Athlete training

Post-Session Insights

Recovery guidance, trend analysis, and zone drift detection.

Dashboard

Complete Performance Dashboard

For Race Day Readiness

Live Lactate Zones Dashboard Screen
Athlete training

Live Lactate Dashboard

Real-time dashboard view with comprehensive lactate analytics and zone monitoring.

Live Lactate Dashboard

Real-time dashboard view with comprehensive lactate analytics and zone monitoring.

Adaptive Intervals Dashboard Screen
Athlete training

Session Analytics

Comprehensive dashboard analytics with detailed session breakdowns and performance insights.

Session Analytics

Comprehensive dashboard analytics with detailed session breakdowns and performance insights.

Trends Dashboard Screen
Athlete training

Trends & Progress

Long-term trend analysis and progress tracking with advanced dashboard visualization.

Trends & Progress

Long-term trend analysis and progress tracking with advanced dashboard visualization.

Analytics Dashboard Screen
Athlete training

Performance Analytics

Advanced analytics dashboard with comprehensive performance metrics and historical data.

Performance Analytics

Advanced analytics dashboard with comprehensive performance metrics and historical data.